
Why 1,000m of Elevation Gain Doesn't Tell the Whole Story
Elevation gain tells you how much you climb — but not where, how steep, or how long you'll be forced to walk. Two routes with identical vertical can demand radically different race strategies.
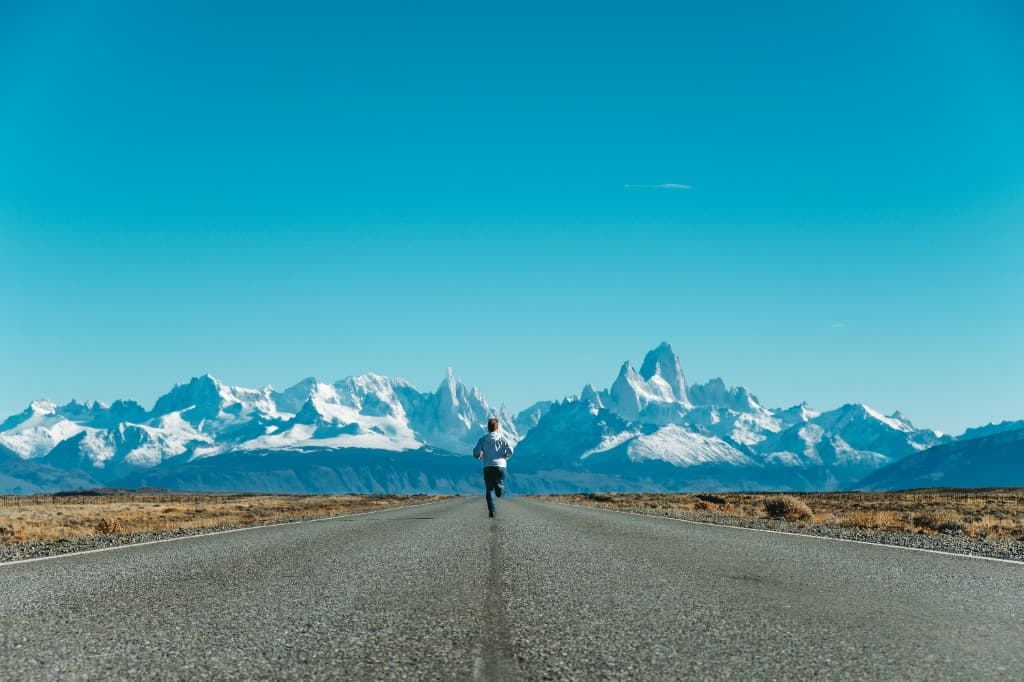
Trail runner on a straight road toward snow-capped Patagonian peaks
In our previous article, we explored how raw elevation gain systematically underestimates the true workload of mountain running — and how Km-effort and Vertical Density provide a more honest baseline. But even those two metrics leave a critical question unanswered:
Where exactly does the climbing happen?
Two routes with identical distance, identical elevation gain, and identical vertical density can feel completely different on race day — because the distribution, gradient, and rhythm of the climbing determine whether you run or hike, whether you blow up on a long wall or recover on a rolling plateau. This article unpacks the three dimensions that raw elevation gain ignores.
1. Gradient Distribution: The Shape of the Climb
Imagine two routes, each with 1,000 meters of elevation gain over 20 km:
- Route A: A single, unrelenting 10 km ramp at a constant 10% grade, followed by 10 km descending back down.
- Route B: Ten separate 1 km climbs of 100 m each, interspersed with flat recovery sections.
Both yield the same number in your Strava summary. But they are physiologically and strategically different workouts.
In Route A, your cardiovascular system, legs, and mental stamina are taxed continuously for 10 km without relief. Your heart rate climbs and stays elevated. Your lactate builds progressively. In Route B, each short climb spikes your effort, but the flat sections allow partial recovery — your average heart rate is lower, your legs flush more frequently, and your pacing decisions reset every kilometer.
This is why gradient distribution is the hidden dimension of elevation data. A climb concentrated in one long wall demands fundamentally different preparation than the same vertical scattered across rolling terrain.
What This Means for Training
- Long concentrated walls (>5 km continuous at >8%) require specific uphill hiking power and mental durability. Training should include back-to-back long climbs with minimal recovery.
- Intermittent climbing profiles reward leg speed and the ability to run through moderate grades. Short hill repeats with full recovery are more transferable.
2. Grade and the Walk-Run Threshold
Here is a fact that surprises many recreational trail runners: elite mountain runners walk too — and they do it strategically.
Elite mountain runners have long demonstrated — and biomechanics research on walking-vs-running energetics supports — that walking steep sections is more efficient overall than attempting to run them. The critical gradient at which walking becomes faster varies by athlete, terrain, and race distance, but a practical rule of thumb widely used across the sport:
Grades above 25–30% are almost universally walked, even by elite competitors. Grades between 15–25% represent the gray zone where the run-walk decision is individual and context-dependent. In longer races (>50 km), accumulated fatigue lowers this threshold further — many runners start walking grades they could run early in a race.
Now consider two routes with +1,000 m over 20 km:
| Route | Max Grade | Time Forced to Walk |
|---|---|---|
| Route C | 12% (fire road switchbacks) | Very little — most sections are runnable |
| Route D | 45% (direct mountain face) | 40%+ of climbing time spent hiking |
Same elevation gain on paper. Completely different race execution. Route D will feel like a different sport.
This is precisely why TrailMetrics tracks your Uphill/Downhill split — not just how much you climb, but how your time is distributed between going up, coming down, and running flat. A high percentage of uphill time on a short route signals aggressive, forced hiking. The same percentage on a longer route might simply reflect a steady, runnable ridge.
3. Elevation Profile Shape: Front-Loaded vs. Back-Loaded Climbs
Even when two routes share the same total gain, the position of the hardest climbing in the race completely changes your strategic approach.
Front-Loaded Profile
The hardest climb comes early — you're fresh but need to resist going out too hard. The reward is that you can open up on the descent and flats with tired legs but a satisfied cardiovascular system.
Risk: Blowing up on the early wall, spending the rest of the race recovering.
Back-Loaded Profile
The hardest climbing comes late in the race. You arrive at the wall already carrying significant fatigue. Every meter of gain costs significantly more than it would have at kilometer 5 — your perceived effort spikes even at the same absolute pace.
Risk: Bonking on the final ascent when glycogen and leg strength are depleted.
Mid-Race Walls
Some courses — particularly classic European ultras — place the highest summit in the middle of the race, followed by a long runnable descent to the finish. This demands conservative pacing in the first third to preserve enough muscular strength for the technical descent.
Practical tip: Before any race or hard training block, sketch the elevation profile with a critical eye. Ask: Where is the hardest kilometer? What will my legs feel like when I get there? Adjust your starting pace accordingly.
4. How TrailMetrics Surfaces This on Your Strava
Beyond Km-effort and Vertical Density, TrailMetrics automatically identifies and reports your longest climb segment — the single continuous ascent with the most cumulative gain — directly in your Strava description:
⛰️ — TRAILMETRICS — 🟠 Rugged Mountain (72 m+/km)

🗺️ Km-effort: 32.4 km (Cat. XS)
⚡ GAP: 5:51/km (best 5:22 · worst 6:44)
🚀 VAM: ↑912 m/h · ↓1483 m/h
🧗 Longest climb: 6.20 km · +780 m
📊 Load: 361 TRIMP (Hard, est.) · 📉 Fatigue: +5.8% (slight fade)
⬆️⬇️ Uphill 71% · Downhill 24%
Breaking down the key signals in this activity:
- Longest climb (6.20 km · +780 m): A single, unbroken ascent accounting for ~58% of the route's total elevation gain (≈1,350 m implied by 72 m+/km × 18.8 km). The climbing is highly concentrated — one dominant wall rather than spread across the full route.
- Uphill 71%: Over two-thirds of moving time was spent climbing. Combined with a rugged 72 m+/km density, this is predominantly a hike-run effort, not a running workout.
- VAM ↑912 m/h: Vertical ascent speed of 912 meters per hour on climbs — a solid benchmark for mountain runners targeting events with long sustained walls.
- Fatigue +5.8%: Grade-adjusted pace slowed by 5.8% between the first and last thirds of the run — a typical fade pattern after a route dominated by one long, sustained climb.
5. The Three Questions to Ask Before Every Mountain Run
Next time you see "+1,000 m" on a route description, resist the impulse to nod and move on. Instead, ask:
- 1Where is it concentrated? One long wall or many short ones?
- 2How steep does it get? Will I be running or hiking the crux sections?
- 3When does the hardest section hit? Fresh legs or fatigued ones?
Elevation gain is the starting point of the conversation — not the conclusion. Understanding the shape of your vertical is what separates runners who execute well from runners who explode on the first steep wall and shuffle home.
In the next article, we'll go deeper into VAM (Vertical Ascent Speed) — what it actually measures, why it's one of the most honest indicators of mountain-specific fitness, and how to use it to set realistic time targets for your next race.
Try TrailMetrics on your next Trail Run
We calculate km-effort, vertical density, grade adjusted pace (GAP), and VAM on every activity, appending it to your Strava description automatically.